
Yoneos ERP, a powerful project management and invoicing software, is designed to streamline your business operations. But how do you make this complex information more accessible and engaging? The answer lies in infographics!
What is Yoneos ERP?
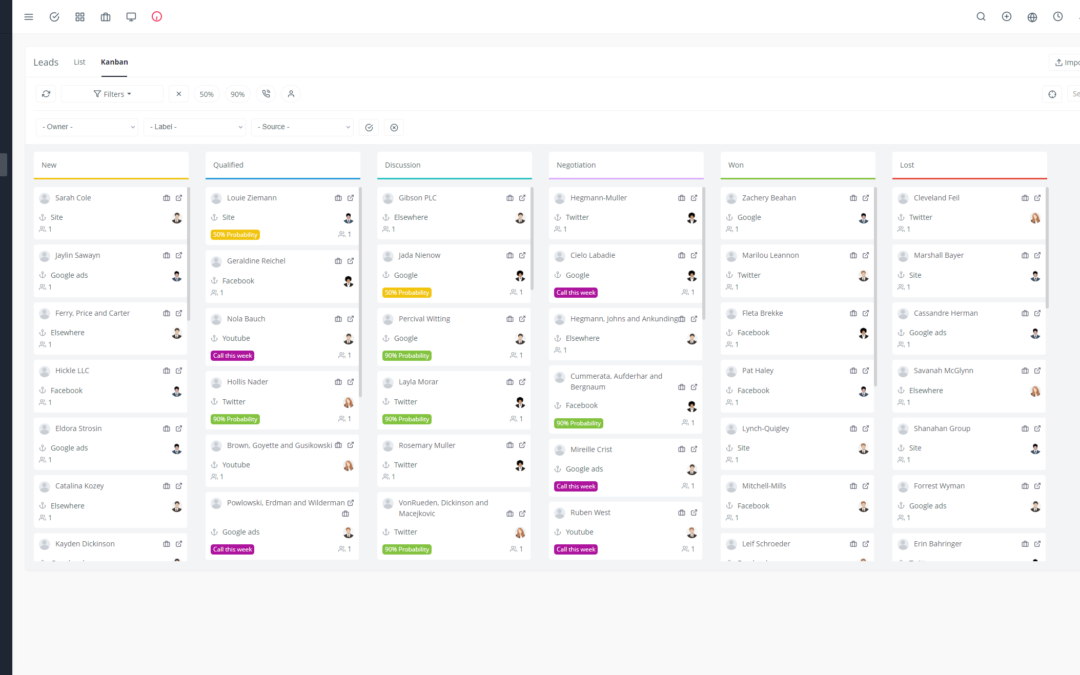
Yoneos ERP is a comprehensive platform that helps businesses manage their projects, invoices, clients, and employees efficiently. It offers time tracking, task management, communication, and reporting features to enhance productivity and transparency.
Introducing Infographics
Infographics are visual representations of complex data and information, using charts, icons, images, and text to make information easier to understand and remember.
Benefits of Infographics for Yoneos ERP
Simplified Understanding: Infographics make it easier to comprehend complex data, such as project reports, financial analysis, and Yoneos ERP usage statistics.
Increased Engagement: Infographics are more visually appealing than text-based documents and can captivate your audience.
Better Retention: The human brain processes visual information faster and more efficiently than text alone.
Easy Sharing: Infographics are easily shareable on social media, blogs, and emails, expanding the reach of your information.
Types of Infographics for Yoneos ERP
Data Infographics: Showcase key data and statistics related to Yoneos ERP usage, such as project growth, average invoicing time, or team performance.
Explainer Infographics: Explain the features of Yoneos ERP clearly and concisely, using relevant illustrations and examples.
Timeline Infographics: Describe the evolution of your business and the impact of Yoneos ERP on your operations.
Process Infographics: Visualize various workflows and key processes in Yoneos ERP, such as project management or the invoicing cycle.
Examples of Effective Infographics
Infographic on the Benefits of Yoneos ERP: Highlight the key advantages of using Yoneos ERP, such as increased productivity, reduced costs, and improved communication.
Infographic on Yoneos ERP Best Practices: Share tips and tricks for using Yoneos ERP to its full potential.
Infographic on Successful Use Cases: Demonstrate how Yoneos ERP has helped other businesses achieve their goals.
Uses of Infographics for Yoneos ERP
Training and Learning: Create visual tutorials to help new employees use Yoneos ERP.
Marketing and Communication: Use infographics to promote Yoneos ERP features and attract new clients.
Reporting and Analysis: Present key data and statistics in an engaging and easy-to-understand way.
Employee Engagement: Create infographics to showcase team performance, share company news, or celebrate successes.
How to Create Infographics for Yoneos ERP
Define Your Goal: What message do you want to convey with your infographic?
Gather Your Data: Collect the relevant information and statistics to present.
Choose a Visual Style: Opt for a clear, appealing design that is tailored to your audience.
Use Tools and Resources: There are many online infographic creation tools available such as Canva, Piktochart, and Venngage.
Tips for Designing Engaging Infographics
Use bright and contrasting colors.
Choose legible and easy-to-read fonts.
Incorporate relevant images and icons.
Keep the design simple and easy to understand.
Use clear and concise language.
Tools and Resources for Infographic Creation
Canva: Intuitive and easy-to-use platform, offering numerous templates and resources.
Piktochart: Provides advanced customization options and animation features.
Venngage: Perfectly suited for creating data and process infographics.
Visme: A comprehensive tool for creating infographics, presentations, and videos.
Best Practices for Using Infographics
Opt for a clear and concise design.
Use appealing colors and fonts.
Incorporate relevant data and statistics.
Add a clear call to action.
Share your infographics on the appropriate channels.
Measuring the Impact of Infographics
Tracking Shares and Engagement: Analyze the number of shares, likes, and comments on your infographics.
Click-Through Rates: If you are using infographics to promote web pages or content, measure the number of clicks on your links.
User Feedback: Ask users for their opinion on your infographics.
Successful Use Cases of Infographics with Yoneos ERP
A web development company uses infographics to showcase project performance to clients.
A marketing agency uses infographics to explain the features of Yoneos ERP to potential clients.
A construction company uses infographics to share project progress reports with partners.
Emerging Trends in Infographics for Yoneos ERP
Interactive Infographics: Allow users to explore data and information in more depth.
Animated Infographics: Use animations to make your infographics more dynamic and engaging.
Data-Driven Infographics: Focus on data and analytics to make informed decisions.
Examples of Yoneos ERP Infographics
https://app.yoneos.com/signup
https://yoneos.com
Integrating Infographics into Marketing Strategies
Use infographics to promote your services and solutions.
Create infographics to answer common customer questions.
Incorporate infographics into your email marketing campaigns.
Using Infographics for Employee Engagement
Create infographics to celebrate team successes.
Use infographics to share important information with employees.
Host infographic contests to encourage creativity and engagement.
Infographics for Training and Learning
Create visual tutorials and guides for employees.
Use infographics to explain complex concepts.
Empower employees to create their own infographics.
Creating Interactive Infographics
Use tools such as ThingLink or Visme to create interactive infographics.
Add links, videos, and animations to make your infographics more engaging.
Analyzing Data with Infographics
Use infographics to visualize data from your Yoneos ERP account.
Create infographics to identify trends and opportunities.
References and Additional Resources
https://app.yoneos.com/signup
https://app.yoneos.com/signup
https://yoneos.com
By strategically using infographics, you can unlock the potential of Yoneos ERP and transform complex data into clear, engaging, and actionable insights. 🚀